Treatment Facilities typically comprise multiple steps or stages of treatment which contribute to the final delivered product, be that safe drinking water or effectively treated wastewater.
Over time the understanding of the value and importance of the individual process steps can fade with focus increasingly applied to the final product, especially in the wastewater context where consent compliance is measured, to a large extent, on discharge quality. This has the potential to mask gradual performance decay in individual process steps as compliance may still be achieved when an individual process step is under-performing.
Fortunately, it is relatively straight-forward, well at least in concept, to identify that this is occurring and that is by:
- Identifying each process step and considering it as an individual performance component
- Identifying the design performance of each process step, potentially from original design information or the assistance of process specialists
- Measuring actual performance for each process step and identifying any performance gaps on a per-process basis, typically through on-site monitoring or laboratory testing

Understanding the design performance of each process step as a first step allows an early understanding of process capabilities and how these relate to current and potential performance requirements. Where final product quality is trending away from objectives for specific performance parameters, it is much more straightforward to identify the process step most likely to need further investigation.
Our approach to interpreting the information involved considering individual parameters, such as BOD5 for Wastewater, across the process steps as a design performance long section where the grade of the parameter identified process-specific performance. Plotting actual measured results against this “grade” provided an easily interpretable gap.
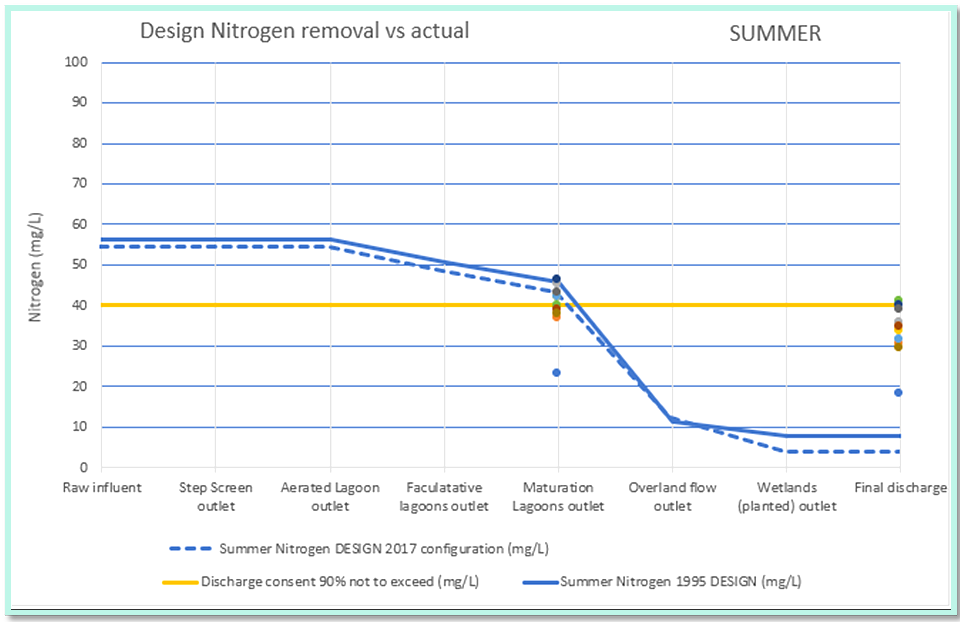
The following chart illustrates the approach.

The chart shows the discharge consent limit (yellow line) plotted against design performance (blue lines) across the process steps.
Actual samples are plotted as individual points, and it can be seen that, although the final discharge consent limit is being achieved, the actual performance is substantially less than design suggest should be achieved.
Additionally, we can see that the performance is consistent with the design for the first several processes but falls off in the final steps and that this is where the focus should be applied for this parameter (Nitrogen).
We have found that adopting this approach sharpens focus and targets resources and spend to the areas that provide the greatest return.


