
Our Operators provide a vital service in the safe, efficient and effective provision of services to our Communities.
They are responsible for the day-to-day operation of vast, complex treatment and reticulation networks, many of which are aged with configuration, function and design less well understood due to the loss of institutional knowledge over time.
Even newly created infrastructure, while supported with high-quality design documentation suffers from a loss of energy in the development of operational guidance.
All too often Operators are left to manage infrastructure through the interpretation of plans and documents whose primary aim was to support contractual engagements and construction, and this is often for our most critical and complex infrastructure.
The lack of dedicated Operator-focused support documentation inhibits understanding and erodes confidence in operational decision-making.
Further, operational information is often collected by the Operators and fed to systems with little in the way of feedback to enhance operational decision making. This one-way flow of information does little to empower Operator decision-making.
Even the best-intended documents often have too broad an audience to offer maximum operational value; Water Safety Plans, for example, have developed into such vast multi-page documents with great depth of detail as to be at risk of losing their operational effectiveness.
The development of short, sharp and concise Critical Control Point documentation is perhaps the perfect indication of how far support has moved from what is operationally required.
We have had great success working with Waitaki District to seek to find better ways to support their Operators through the development of Operator-centric tools and documentation.

Tools and processes have been developed that allow the Operators to:
- Plan and schedule workloads through scheduling and resource balancing techniques
- Plan and manage work tasks through project scoping and assessment techniques
- Visually track chlorine residuals through prominent, spatial displays
- Plan daily water production needs by dash-board type calculation tools
- Add transparency to decision making by the addition of simple recording mechanisms
- Better understand SCADA data by collecting and displaying compatible information
- Better understand treatment performance by live charting of logbook and SCADA inputs against target performance
- Understand pumping and piping
All of the above tools are specifically designed to work for operators with a focus on providing only sufficient information to be immediately beneficial to the operators.

A good example is understanding pumping and piping. For pumping the approach involved producing simplified pipeline and pump curves for each rising main and pump model respectively and plotting these on transparencies.
By overlaying the transparencies, Operators can rapidly determine if a pump will be hydraulically adequate in another installation – a vital knowledge point when addressing a pump failure.
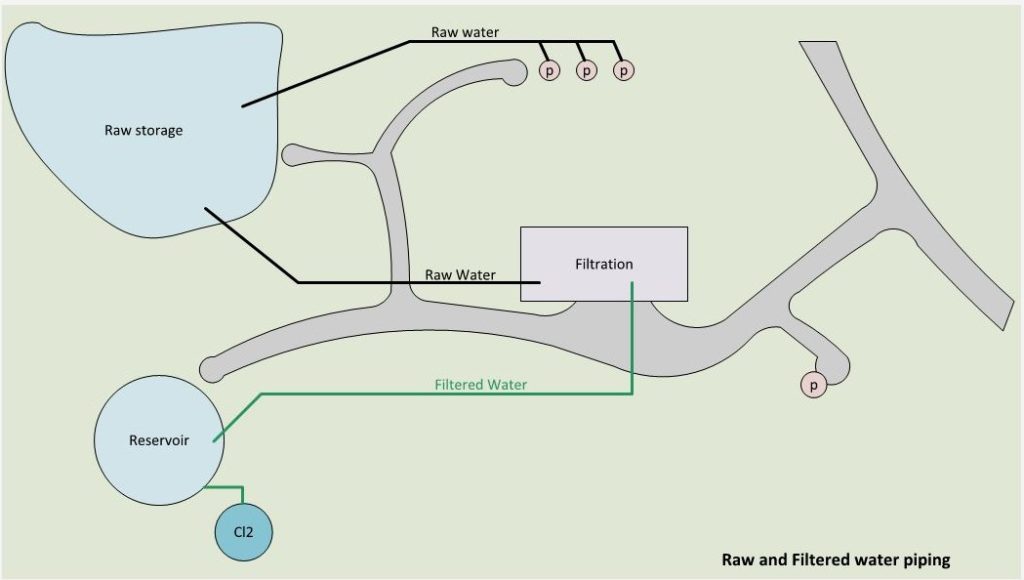
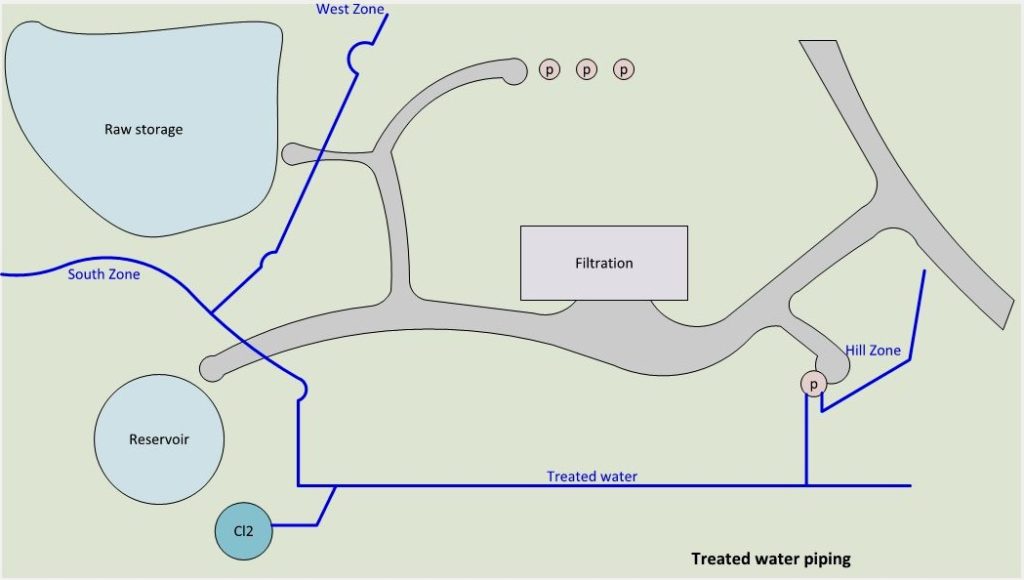
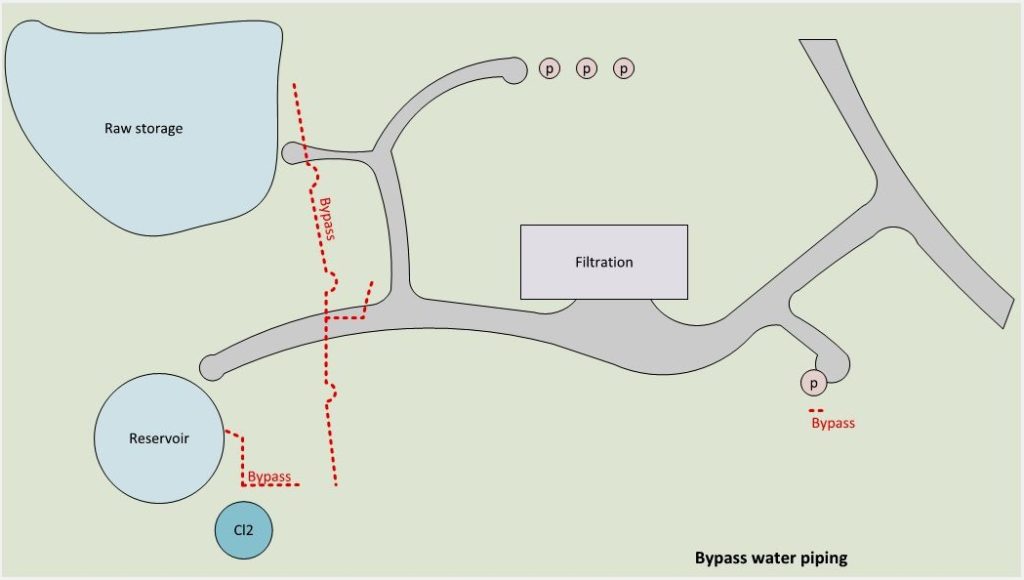
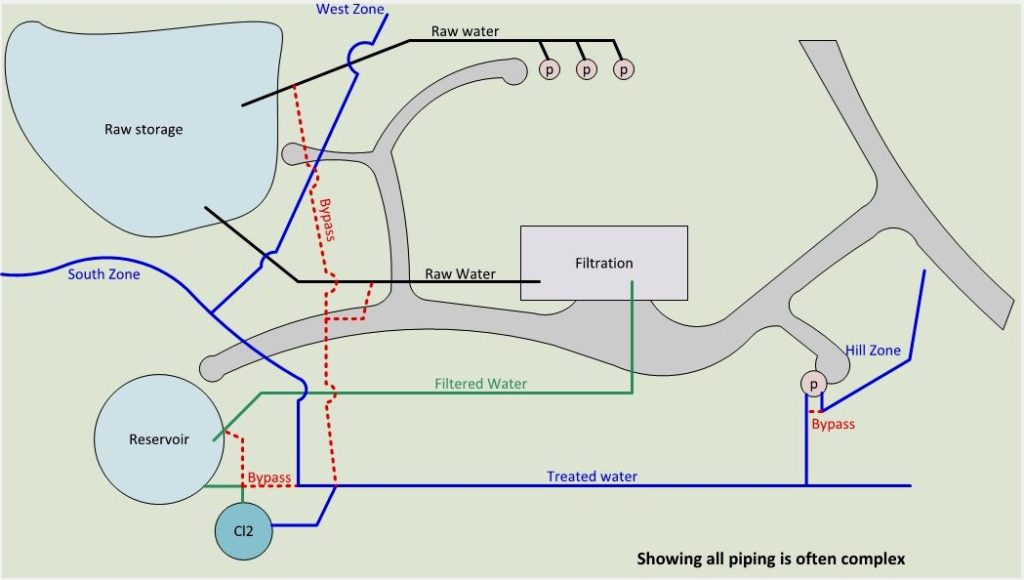
Piping understanding took a similar approach with semi-spatial schematic diagrams created with different “purpose” piping reflected on different transparencies.
Operators can build up knowledge and understanding by adding individual transparencies.
For example, the base layer may show basic geographical features (buildings, reservoirs and the like) over which can be lain the raw water pipes, filtered water pipes, treated water pipes, bypass pipes or valves and so forth.
As few or many layers as are necessary to guide decisions can be viewed, and should complexity lead to confusion, layers can be removed to “reset” the understanding.
To illustrate my point, I’ve created a model Water Treatment Plant pipework. Please click on either the right or the left arrowhead to browse the layers.

